Debt, Wealth, and the Great Recession
March 2011
Understanding the American Economy
•Over the past 15 years, an underlying story is the role of credit
•GFC has thrust debt squarely into the consciousness of economists
•Likely to be integral to the future course of the economy
–Supply and Demand for credit in the Big 3: Households, Businesses and Government
–Conventional wisdom provides good framework for supply effects
•Proper diagnosis of credit-crunch
–Fails to account for demand-side deleveraging shocks and debt-overhang
•Implications on policy chosen, successes and failures
The Game Plan
1. Theoretical consideration of credit and wealth
2. Recent role of debt in American economy
3. Japanese comparison
4. Policy implications and future prospects
Credit in the Economy- Supply
•How can borrowing and lending play a driving force in the real economy?
-Fed Reserve Chair Bernanke among foremost economist on topic
•Banks monitoring costs are inverse to borrowers collateral- more wealth people have, the more bank is willing to lend- falling bank-loan rates spur investment, accelerating original increase in output
“Credit Channel Accelerator”
-Crisis can increase bank-loan rates, reducing credit in the economy, lowering output and pushing down nominal interest rates (more later)
Bank Lending Channel
•Health of banks also a clear factor in lending rates, supply of credit
–Eg. Size of collateral, balance-sheet, lines of credit, liquidity, all impact how easily they can raise money themselves, willingness to lend- resulting feedback effects
–Implies the effects of monetary policy have larger effects on real economy than accounted for
•Bank Reserve ratios, money supply, powerful tools over banking system used by policy makers in “Great Moderation” (1990-2007) to “stabilize” economy
Credit Demand
•Framework predicts increased credit demand bids up bank rate, reducing nominal rate and overall demand
-- However fails to capture nature of how balance-sheet problems can change sensitivity of loan demand to interest rates
–Deleveraging shock? Can fall in debt limit force distress-selling/default that leaves debt-overhang?
-- Excess money can get stuck in banking system without willing borrowers, as people either paying back loans, or defaulting on them
-- Excess money can get stuck in banking system without willing borrowers, as people either paying back loans, or defaulting on them
•Rare, but there have been episodes of falling debt despite available credit- Great Depression, Japan’s Lost Decade
The Wealth Effect
–Increasing/Decreasing housing wealth is a key factor for growth in consumption/investment
–Evidence from past cycle indicates supply was prime driver during run-up- related to massive increase in lending to previously unqualified borrowers
–Demand AND supply falling during recession
•1-2 Punch
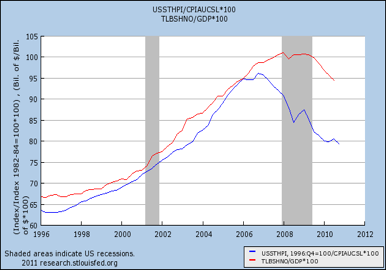
Some Historical Context
•Corporate Debt (Blue) and Household Debt (Red) as % GDP

Clearly there is a story to tell here!
Entering the decade…
•1990’s, early 2000’s a story of corporate the corporate balance sheet
–Tech boom and relatively low interest rates spur corporate investment, borrowing
–Once the cycle ends, investment/borrowing growth decreases rapidly
–Over the course of ’00-01 recession Fed cuts rate to 1% lasting 3 years
Equipment/Software Investment as % GDP vs Fed Funds Rate

2001 recession/aftermath a foreshadow of things to come
•Fall in corporate borrowing (-10%GDP) related to supply or demand for credit?
–Supply: relatively minor blip in lending mkts, bank surveys indicate tightening standards
–Demand: Interest rates still historically very low, companies with good credit ratings not increasing investment, strong growth in cash flow
•Fed Chief Alan Greenspan, so-called expert on credit-supply surprised by “Debt-rejection syndrome”
•Issue is Demand! Companies focused on repairing balance-sheets despite low interest rates
•Debt-overhang helps explains relatively slow recovery from 2002-04
Who steps in? Households
•Late 90’s, emergence of hhld credit boom- Debt/Income ratio rises from 2.2 to 3 from ‘02-’06, add $6trillion in debt
• Supply factors drive buble: low rates, foreign savings-glut, securitization/financial innovation, gov policy, etc
–Rise of credit inextricably linked to booming house prices, residential investment
–Credit primarily increasing going to ppl with falling incomes, (first time ever)
–Mortgage refinancing and expected rising prices help continue bubble
Great Recession Pt. 1 07-08: Falling Demand
-House prices peak in ‘06, debt-growth slows
-Foreclosures start rising, prices/residential investment/durable consumption start falling only in indebted (bubble) regions
-Feedback loop breaks down- wealth effect from falling assets causes people to reach debt-limit, defaults begin- people just tapped out!
–Local credit supply constraints? Unlikely, falling credit irrespective of whether
–Only focused on credit-supply, Fed reserve sits on its hands as default problem grows
•Survey results indicate falling demand for loans before supply
–Non-leveraged regions/ businesses not pulling back yet
•“The fundamentals of our economy are strong”- John McCain
•“As long as the music is playing, you’ve got to get up and dance. We’re still dancing.”- Chuck Prince (CEO Citi Group)
Hhld Liabilities/GDP (Red) vs Real House Prices (Blue)
Change in Hhld Liabilities/GDP (Red) vs Change in Real House Prices (Blue)

Household Wealth as % GDP

Crash in housing bring along drop in wealth of approx 1 year’s GDP ($13 trillion)
Great Recession Pt. 2 (08Q3-09): Credit Crunch
•Amid the rise of hhld credit the financial system takes on considerable debt
•As asset prices began falling, the illiquidity and opaque nature of securities create distress selling, asset prices and stock markets spiraling downward, job losses
–Bank rates rise, nominal rates fall- consistent with conventional wisdom
–Sept ‘08 Lehman Shock, and freezing of the short-term paper market
–Without short term borrowing companies literally would have no cash to pay their workers next paycheck!
1-2 Punch: Falling Supply AND Demand for Credit
Bank Survey Respondents:
% of banks tightening standards for consumer (blue), business (green) loans
% of banks reporting higher demand for consumer (red), business (orange) loans

-Notice low orange-line in early 2000’s- Corporate -Debt Rejection
-Red-line begins falling steadily in 06’, reaches lowest point during worst of recession
-Blue-line rises later in ’07 (credit crunch)
-Demand indicators have only returned to 0% (eg no more falling demand) despite over 3 years at very low interest rates
-Shows Debt-overhang, people paying off debt or defaulting!
Rescue efforts
•Blind-sided by the crash, authorities spring into action
-Fed Gov: Takes on the debt, primarily from falling tax revenue
–TARP, Bank Bailouts
–700Bn stimulus in early ‘09
•Federal Reserve follow their textbooks: Save credit supply!
–Lower funds rate to 0%, pumping money into banks
–Launch Quantitative Easing- massive expansion of money supply, buys bank assets, all to lower long-term rates/prevent deflation, stimulate credit
Approach follows their theoretical disproportionate focus on credit supply: explains slow response to default problems but aggressive towards banking crisis. Shows in successes and failures of policy
Approach follows their theoretical disproportionate focus on credit supply: explains slow response to default problems but aggressive towards banking crisis. Shows in successes and failures of policy
Aftermath
•Recession officially ends in summer ‘09
-Unemployment, house prices finally reach a plateau, stock-market rebounds
–Interest rates remain low despite increasing government deficit
–“L-shaped” recovery consistent with financial crises
-Recent data shows slow improvements
GDP (Red) vs Long-run GDP Trend (Blue)

Going Forward:
Household Balance-Sheets are still struggling, concentrated in high-leverage regions

Debt-overhang, high unemployment concentrated in bubble States (eg Florida, Nevada)

Liquidity Trap: Broken Banks or Balance-Sheets?
-Historical there is link btw growth of Base Money (Red- amount of bills floating around), Credit (Green- eg amount of hhld debt) and the Money Supply (Blue- amount of money flowing btw all goods, financial, and credit mkts)
 |
-Rise in Red-line (bills floating around) represents Federal Reserve money injection
-However its clear link btw Base Money and Credit is broken
-Where is this extra money? Sitting in some bank vault!
- Credit supply issue? Unclear, could be banks are unwilling to lend, maybe they are bankrupt?
-Concentration of debt-overhang indicates its likely a demand problem- households on average are paying back their debt or defaulting on mortgages! No desire to borrow despite available credit
-Housing prices haven’t started recovering

(OECD)
•Corporations went on epic binge in late 80’s with associated rise in land prices
–Crash in ‘91 sees deceleration of growth and credit ala Great Recession pt 1., full out deleveraging by ‘95 despite falling bank-lending rates
•By 1997 banking problems emerge causing credit crunch
•Still, demand issues override:
–Monetary actions, bank injections have no effect
–Like US, divergence btw growth in base money and credit- funds are stuck in banking system
–Survey’s indicate company’s not finding it difficult to find loans- to busy paying off debt
–Were internal banks the problem, should have been great chance for foreign banks yet few succeed
Comparisons between Japan and US
•American response to credit tightening, insolvency, has been much more aggressive, relatively stronger bank-lending channel
–Eg bounce-back in US stock prices vs 20 year decline in Japan
–Japanese loss in wealth worse than US
•Base money has lost influence on growth of credit, which drives money supply
–Falling money supply can cause deflationary spiral and rapid econ contraction
•eg US Great Depression ‘29-33: Lending= -47%, Money Supply= -33%, GDP= -50%
– In both examples MS never actually decreases, despite falling private sector credit. Why?
Implications for Fiscal Policy
-Government borrowing at start of both recessions supported M2 growth
–To date, low interest rates indicate private sector credit demand not being crowded out higher deficit
–Serious implications for deficit reduction if private sector credit unable to drive M2 growth
•Both ‘97 and ‘01 Japanese attempts at austerity seriously weaken economy undermining deficit reduction itself- policies forced to be reversed
•US 1937 deficit reduction shows similar effects
•Did the UK cut too early in summer 2010?
–Important to separate current downturn deficit from larger-scale long-run aging-population related deficits
–Will cutting now matter in 2040?
–Who knows how long before deficit noticeably undermines economy
Implications for Monetary Policy
•Raising nominal rates would likely increase debt-burden on deleveraging households
–However wild swings in base money without results display limitations of monetary policy
•Excess reserves could drive future credit bubble if remaining by time loan-demand resumes/banking issues are resolved
–Further QE likely less important for Fed’s role in helping sustain recovery than ensuring functioning banking system, lending channel
–Must learn from mistakes and consider credit demand, pursue rescue policy options that can help everyday people
Future Prospects
•Deficit reduction requires private sector recovery
•Where is there room to Grow?
–Business sector: indications of increasing optimism
•Relatively healthy balance sheets/cash-flow
•Can actually drive productive investment (eg computers) rather than residential investment (eg hot-tubs!)
–Exports: growth in developing world provides larger customer-base, aided by depreciating dollar
–Household’s role contingent on recovery in housing, credit
•Slow recovery, things stopped getting worse- high leveraged regions with debt overhang
–Clear that balance sheet of each sector will play a major role in future of the American Economy!
The End